Google Classroom
GeoGebra
GeoGebra Classroom
Sign in
Search
Google Classroom
GeoGebra
GeoGebra Classroom
Outline
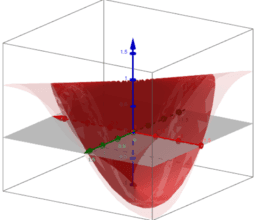
Visualization of limits of functions of two variables
Introduction
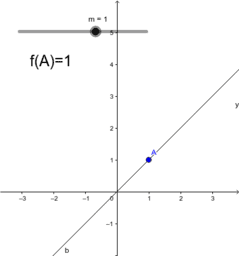
Example 1
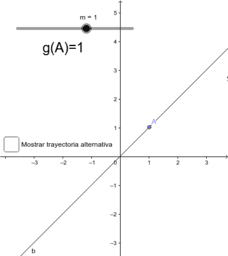
Example 2
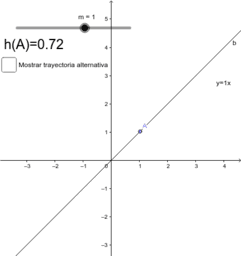
Example 3
Polar coordinates: Example 1
Polar coordinates: Example 2
Polar coordinates: Example 3
Thank you very much
Visualization of limits of functions of two variables
Author:
Laura del Río
Topic:
Functions
,
Limits
Presentation for sharing at the GeoGebra Global Gathering 2017
Introduction
Example 1
Example 2
Example 3
Polar coordinates: Example 1
Polar coordinates: Example 2
Polar coordinates: Example 3
Thank you very much
Next
Introduction
New Resources
Shadow of a Cube (v2)
Quiz: Finding Average Rate of Change
Icosahedron
Variation Theory Parallelogram Proofs
Average Rate of Change: Graph a Function (2)
Discover Resources
رسم توضيحي للمسألة 21 الوحدة الاولى
Zukei Level 7
Cycloid 1
Teste
CECEWEKSTEIN_HW1
Discover Topics
Similarity Transformation or Similarity
Equations
Frequency Distribution
Secant Line or Secant
Plane Figures or Shapes